The crypto world is a vast expanse of opportunities, risks, and ever-evolving trends. At the heart of this dynamic landscape lies the eternal tussle between two market sentiments: bullish and bearish. As topical authorities in this niche, we’ve previously delved deep into bullish signals. Today, we’re venturing further to juxtapose these two sentiments, offering you a comprehensive guide to navigate the crypto seas with confidence.
Table of Contents
What Exactly Are Market Sentiments?
At its core, market sentiment is the collective emotional and psychological state of market participants. It’s the overarching mood or feeling that investors and traders have about the future prospects of a particular asset, be it stocks, commodities, or cryptocurrencies. This sentiment, whether optimistic or pessimistic, can influence buying and selling decisions, often driving prices up or down.
Factors Influencing Market Sentiment
Several elements come into play when shaping market sentiment:
News and Media
A positive news article about a company’s earnings or a negative report about geopolitical tensions can sway sentiments overnight.
Economic Indicators
Data such as employment rates, inflation figures, and GDP growth can provide insights into the health of an economy, influencing overall market sentiment.
Historical Data
Past performance, while not a guarantee of future results, can set certain expectations and influence sentiment.
Social and Cultural Trends
The rise of environmental consciousness, for instance, can boost green energy stocks and shape positive sentiments around them.
The Power and Peril of Sentiments
Market sentiments hold immense power. A strong positive sentiment can lead to bull markets, where prices rise, and optimism reigns. Conversely, negative sentiment can herald bear markets, characterized by falling prices and prevailing pessimism.
However, sentiments can also be perilous. Over-reliance on the prevailing mood can lead to herd behavior, where individuals make decisions based on what everyone else is doing rather than their analysis. This behavior can amplify market volatility and lead to bubbles or crashes.
Measuring Market Sentiment
While sentiments are inherently intangible, several tools and indicators aim to quantify them:
Surveys
Periodic polls of investors or analysts to gauge their feelings about market directions.
Volatility Index (VIX)
Often termed the “fear index,” it measures expected market volatility and is inversely related to market sentiment.
Breadth Indicators
These assess the number of assets advancing versus those declining in a market, offering insights into overall sentiment.
The Rise of the Bulls: Understanding Bullish Sentiments

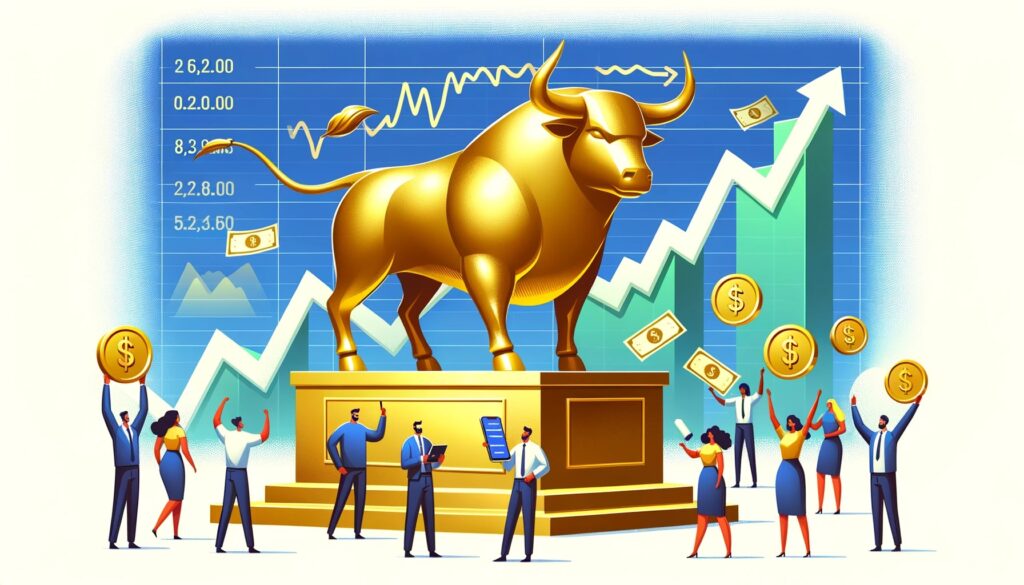
The term “bullish” often evokes images of a powerful bull charging forward, unstoppable in its momentum. In the financial realm, this imagery translates to a market characterized by rising prices and a general sense of optimism. But what fuels this bullish fervor, and how can one navigate its waves?
Catalysts Igniting Bullish Flames
Several factors can trigger and sustain a bullish market:
- Positive Economic Indicators: Robust GDP growth, low unemployment rates, and favorable corporate earnings can bolster investor confidence, leading to increased buying activity.
- Technological Breakthroughs: In sectors like tech or biopharma, a significant innovation or a groundbreaking product can send prices soaring.
- Regulatory Support: Favorable government policies or regulatory decisions can provide a conducive environment for growth, especially in sectors like renewable energy or fintech.
- Market Psychology: Sometimes, the sheer optimism of a few can spread, leading to a positive feedback loop where rising prices attract more buyers, pushing prices even higher.
Recognizing the Footprints of a Bull
Identifying a bullish market early on can offer lucrative opportunities. Here are some tell-tale signs:
- Price Patterns: Technical analysts often rely on specific chart patterns, such as the “Golden Cross” or “Ascending Triangle,” to predict bullish breakouts.
- Volume Surge: An increase in trading volume can indicate heightened interest and a potential bullish trend.
- Media and News: A surge in positive news articles, expert endorsements, or optimistic forecasts can be indicative of a bullish sentiment.
Strategies for the Bullish Dance
While a bullish market offers the promise of high returns, it’s essential to tread with caution:
- Diversification: Don’t put all your eggs in one basket. Spread investments across sectors and asset classes.
- Set Profit Targets: Decide in advance the price point at which you’ll sell and take profits.
- Stay Informed: Keep abreast of global events, sectoral news, and economic indicators. A bullish sentiment can turn bearish with changing circumstances.
The Descent of the Bears: Decoding Bearish Sentiments

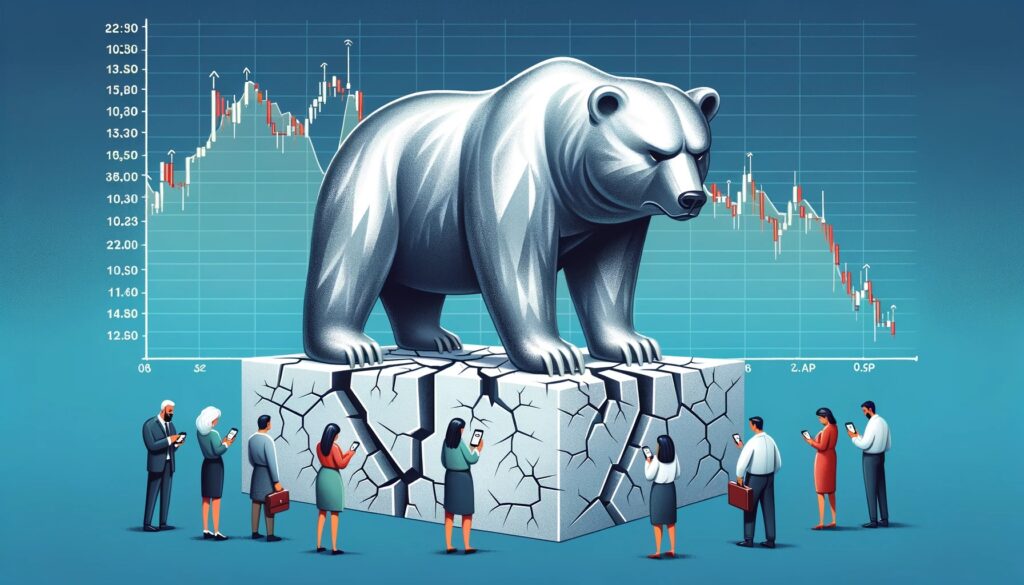
When the market mood turns somber and prices begin their downward spiral, the bears emerge from the shadows. The term “bearish” paints a picture of a bear, powerful yet defensive, often seen swiping its paws downward. In the financial landscape, this translates to declining prices and a prevailing sense of pessimism. But what awakens the bear, and how can one prepare for its descent?
Triggers for the Bear’s Awakening
Several elements can initiate and perpetuate a bearish market:
- Economic Downturns: Recessions, rising unemployment, or declining consumer spending can cast a shadow of doubt over the market’s future prospects.
- Geopolitical Tensions: Wars, trade disputes, or international conflicts can disrupt global trade and investment flows, leading to bearish sentiments.
- Regulatory Crackdowns: Stringent regulations or unexpected policy changes, especially in sectors like tech or finance, can dampen investor enthusiasm.
- Market Overvaluation: If assets are perceived to be overpriced, a correction might ensue, leading to a bearish phase.
Signs of the Looming Bear
Detecting a bearish market early can be crucial for risk mitigation. Here are some indicators:
- Descending Price Patterns: Patterns like the “Death Cross” or “Descending Triangle” can be harbingers of bearish downturns.
- Increased Volatility: Erratic price movements and heightened uncertainty can signal a bearish trend.
- Media and News: A surge in negative news, pessimistic forecasts, or expert warnings can reflect a bearish sentiment.
Navigating the Bear’s Territory
While a bearish market might seem daunting, it’s not devoid of opportunities:
- Defensive Investing: Consider shifting to assets or sectors known for stability during downturns, like utilities or consumer staples.
- Short Selling: This strategy involves selling assets you don’t own, hoping to buy them back at a lower price, profiting from the difference.
- Stay Educated: Continuously monitor global events, sector-specific news, and economic data. Knowledge is the best defense against market uncertainties.
Bullish vs Bearish: A Comparative Glimpse
The financial markets are a dance of two dominant forces: the bulls and the bears. While both play pivotal roles in shaping the market’s trajectory, they represent contrasting sentiments, strategies, and outcomes. To truly grasp the essence of the market, one must understand the nuances that differentiate these two forces.
The Tale of Two Sentiments
At the heart of every market movement lies sentiment. It’s the collective emotion, perception, and expectation of investors and traders. While bullish sentiment radiates optimism and confidence in rising prices, bearish sentiment is characterized by caution and anticipation of a decline.
Comparative Chart: Bulls vs Bears
| Aspect | Bullish Sentiment | Bearish Sentiment |
|---|---|---|
| Definition | A market condition where prices are expected to rise. | A market condition where prices are expected to fall. |
| Market Mood | Optimistic and confident. | Pessimistic and cautious. |
| Driving Factors | Positive economic data, technological advancements, favorable regulations, strong corporate earnings. | Economic downturns, geopolitical tensions, regulatory crackdowns, perceived market overvaluations. |
| Typical Strategies | Buying and holding, leveraging, diversifying into growth sectors. | Short selling, hedging, diversifying into defensive sectors. |
| Risks | Over-optimism leading to overvaluation, ignoring negative signals. | Over-pessimism leading to missed opportunities, misinterpreting positive signals. |
| Historical Indicators | Patterns like Golden Cross, Ascending Triangle. | Patterns like Death Cross, Descending Triangle. |
| Economic Indicators | Rising GDP, low unemployment, high consumer spending. | Recession, high unemployment, low consumer spending. |
| Media Coverage | Positive news, endorsements, optimistic forecasts. | Negative news, warnings, pessimistic forecasts. |
| Investor Behavior | Increased buying activity, reduced interest in safe-haven assets. | Reduced buying activity, increased interest in safe-haven assets. |
The Interplay and Cyclic Nature
Markets are inherently cyclical. Bullish phases, characterized by growth and prosperity, are often followed by bearish phases of correction and consolidation. Recognizing the signs and understanding the dynamics of these cycles can empower investors to make informed decisions, whether it’s capitalizing on growth opportunities during bullish times or safeguarding investments during bearish downturns.
Tools to Gauge Market Sentiments
In the intricate tapestry of financial markets, understanding the prevailing sentiment is crucial. It’s the compass that can guide investors through calm seas and stormy waters alike. But how does one measure something as intangible as sentiment? Fortunately, several tools and indicators have been developed over the years to quantify and interpret market moods.
The Toolbox for Market Sentiments
While sentiments are inherently subjective, they leave behind traces that can be measured, analyzed, and interpreted. These tools range from technical indicators on price charts to surveys that capture the mood of investors.
Detailed Chart of Tools
| Tool Category | Specific Tool | Description | Bullish or Bearish Indicator |
|---|---|---|---|
| Technical Analysis | Moving Averages | Averages of asset prices over specific periods. Crossing of short-term over long-term is a bullish sign. | Bullish when short-term crosses above long-term; Bearish when below. |
| Relative Strength Index (RSI) | Measures the speed and change of price movements. Ranges from 0 to 100. | Bullish above 70; Bearish below 30. | |
| MACD (Moving Average Convergence Divergence) | Compares short-term momentum to long-term momentum. | Bullish when MACD crosses above signal line; Bearish when below. | |
| Fundamental Analysis | Earnings Reports | Quarterly reports on a company’s performance. | Bullish with positive earnings; Bearish with negative. |
| Economic Data | Data like GDP, unemployment rates, and inflation figures. | Varies based on specific data and expectations. | |
| Sentiment Analysis | Investor Surveys | Polls capturing the mood and expectations of investors. | Bullish with positive sentiment; Bearish with negative. |
| News & Media Analysis | Analyzing the tone and content of news articles and media reports. | Bullish with positive coverage; Bearish with negative. | |
| Breadth Indicators | Advance-Decline Line | Compares the number of assets that advanced in price to those that declined. | Bullish with more advances; Bearish with more declines. |
| Market Volatility Index (VIX) | Measures expected market volatility. Often termed the “fear index.” | Bullish with low VIX; Bearish with high VIX. |
The Art and Science of Using These Tools
While these tools offer valuable insights, it’s essential to use them judiciously. No single tool provides a complete picture, and often, the best insights come from a combination of multiple indicators. For instance, a bullish signal from technical analysis might be validated by positive sentiment in investor surveys, offering a more robust basis for investment decisions.
Moreover, it’s crucial to understand the limitations of each tool. While technical indicators are based on past price data, fundamental analysis focuses on intrinsic value, and sentiment analysis captures the prevailing mood. Each offers a unique perspective, and together, they provide a holistic view of the market’s sentiment.
Examples of Bullish and Bearish Cycles in Crypto

The cryptocurrency market, known for its volatility, has seen numerous bullish and bearish crypto cycles since its inception. These cycles, often more pronounced than traditional markets, offer valuable insights into the dynamics of crypto trading, investor behavior, and the impact of external factors. Let’s delve into some notable examples of these cycles in the crypto realm.
Bullish Cycles in Crypto
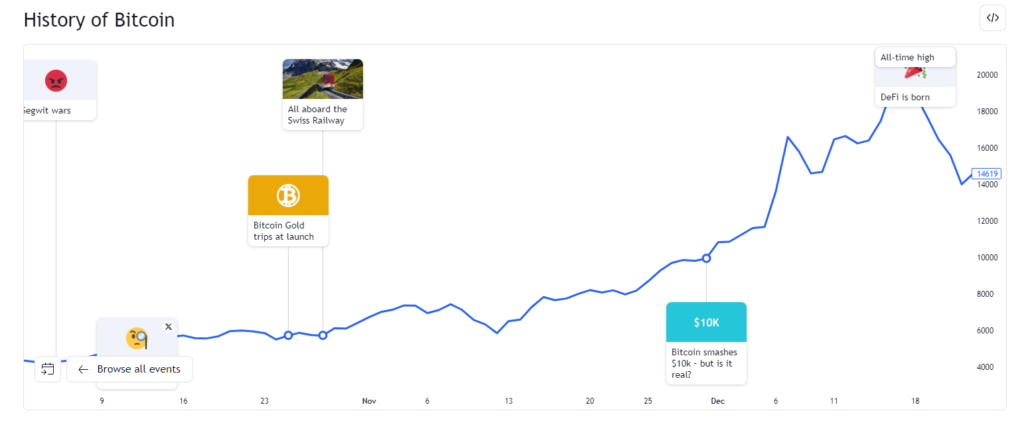
1. Bitcoin’s Meteoric Rise in 2017:

Starting the year at just under $1,000, Bitcoin reached an all-time high of nearly $20,000 by December 2017.
- Factors Driving the Bull Run: Increased media coverage, growing public interest, institutional adoption, and the ICO (Initial Coin Offering) boom contributed to this surge.
2. Ethereum’s Breakthrough in 2020-2021:
Ethereum, the second-largest cryptocurrency by market cap, saw its price soar from around $130 in early 2020 to over $4,000 by mid-2021.
- Factors Driving the Bull Run: The rise of DeFi (Decentralized Finance) platforms, NFTs (Non-Fungible Tokens), and upgrades to the Ethereum network fueled this bullish cycle.
3. Altcoin Rally of 2021:
Alongside Bitcoin and Ethereum, many alternative cryptocurrencies (altcoins) like Binance Coin, Cardano, and Polkadot experienced significant gains.
- Factors Driving the Bull Run: Diversification by investors, new blockchain projects, and increased adoption of crypto in various industries played a role.
Bearish Cycles in Crypto
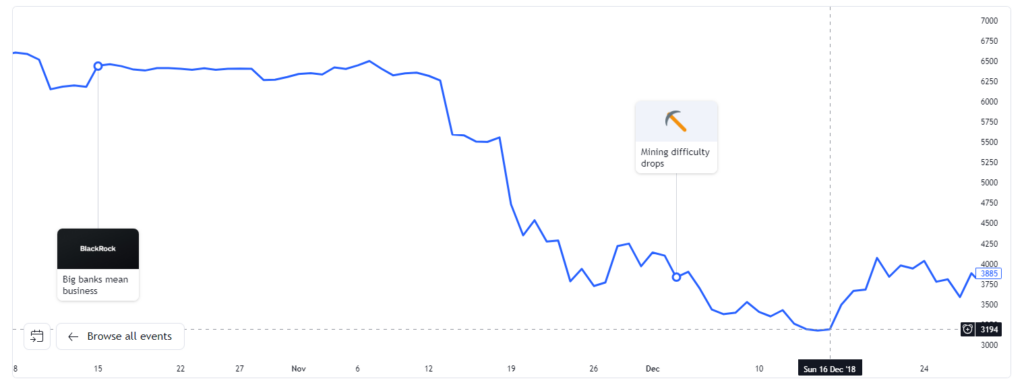
1. The Great Crypto Crash of 2018:

After reaching all-time highs in late 2017, the crypto market faced a severe downturn throughout 2018, with Bitcoin dropping below $3,500 by year’s end.
- Factors Driving the Bear Market: Regulatory crackdowns, high-profile hacks, market overvaluation, and the bursting of the ICO bubble contributed to the decline.
2. COVID-19 Induced Crash in March 2020:
The global financial markets faced a massive sell-off due to the COVID-19 pandemic, and the crypto market wasn’t spared. Bitcoin’s price halved within a day.
- Factors Driving the Bear Market: Uncertainty around the pandemic, liquidation events, and a rush to cash caused this sharp downturn.
3. China’s Crypto Ban in 2021:
Cryptocurrencies faced another bearish phase when China intensified its crackdown on crypto mining and trading.
- Factors Driving the Bear Market: The loss of a significant mining region, coupled with regulatory uncertainties, led to a drop in crypto prices.
Lessons from the Cycles
The crypto market, with its decentralized nature and global reach, is influenced by a myriad of factors. While technological advancements and adoption can lead to bullish phases, regulatory challenges and global events can trigger bearish cycles. For investors, these examples underscore the importance of due diligence, diversification, and a long-term perspective. As the crypto space continues to evolve, understanding its past cycles can provide valuable insights for navigating future trends.
Navigating Bullish and Bearish Markets: Top Tips

The financial markets, with their ebb and flow, present a myriad of opportunities and challenges. Whether you’re riding the high waves of a bullish market or bracing against the winds of a bearish downturn, having a strategy is paramount. Here are some top tips to help you navigate both terrains with finesse and confidence.
Embracing the Bull: Strategies for Bullish Markets
1. Stay Informed:
Keep abreast of global events, sector-specific news, and economic indicators. Knowledge is power, especially in a rapidly rising market.
- Why it Matters: Staying updated helps in capitalizing on opportunities and avoiding potential pitfalls in an ever-evolving market landscape.
2. Diversify, but Strategically:
While diversification is a cornerstone of investment, it’s essential to focus on sectors and assets poised for growth in bullish times.
- Why it Matters: Strategic diversification can maximize returns while mitigating risks.
3. Set Realistic Profit Targets:
Decide in advance the price point at which you’ll sell and take profits.
- Why it Matters: Having a clear exit strategy prevents emotional decision-making and ensures you lock in profits at the right time.
4. Avoid the Herd Mentality:
While it’s tempting to follow the crowd, especially during euphoric bullish phases, independent research and analysis are crucial.
- Why it Matters: Herd behavior can lead to asset bubbles and overvaluation, increasing the risk of sharp corrections.
Bracing for the Bear: Strategies for Bearish Markets
1. Seek Safe Havens:
Consider shifting to assets or sectors known for stability during downturns, like utilities, bonds, or precious metals.
- Why it Matters: Safe-haven assets can offer protection against significant losses in turbulent times.
2. Consider Hedging:
Use financial instruments like options or futures to offset potential losses in your investment portfolio.
- Why it Matters: Hedging can provide insurance against market downturns, ensuring portfolio stability.
3. Avoid Panic Selling:
While the initial reaction might be to sell during a market drop, it’s essential to evaluate the long-term potential of your investments.
- Why it Matters: Panic selling can result in selling assets at a loss, missing out on potential rebounds.
4. Re-evaluate and Rebalance:
Bearish markets offer an opportunity to assess your portfolio, weed out underperformers, and realign with your investment goals.
- Why it Matters: Regular rebalancing ensures your portfolio aligns with your risk tolerance and investment objectives.
The Golden Rule: Stay Calm and Carry On
Regardless of market conditions, one principle remains unchanged: the importance of keeping emotions in check. Whether it’s the euphoria of a bullish run or the anxiety of a bearish phase, decisions driven by emotions can cloud judgment and lead to suboptimal outcomes. By staying informed, sticking to a well-thought-out strategy, and maintaining a long-term perspective, you can navigate the highs and lows of the market with poise and purpose.
Conclusion
The bullish phases, with their promise of growth and prosperity, evoke a sense of optimism and opportunity. They’re times of innovation, expansion, and the thrill of witnessing assets soar to new heights. On the other hand, the bearish periods, while seemingly daunting, are essential for market equilibrium. They offer moments of reflection, correction, and the chance to lay a stronger foundation for future growth.
But beyond the technicalities and market jargon, there’s a deeper lesson to be gleaned. The cyclical nature of the markets mirrors the ebb and flow of life itself. There are times of abundance, growth, and celebration, followed by periods of caution, consolidation, and introspection. And just as in life, the key to navigating the financial markets lies in balance, education, and resilience.
By understanding the nuances of bullish and bearish sentiments, and by equipping oneself with the right tools and strategies, investors can not only safeguard their investments but also thrive. It’s about seeing the opportunities in every market condition, learning from past cycles, and forging ahead with clarity and confidence.
As we journey through the ever-evolving world of finance, let’s remember that every bull run and every bear descent is a chapter in a larger story. A story of innovation, adaptability, and the indomitable human spirit that, time and again, rises to the occasion, learns, grows, and emerges stronger.
FAQs
Why are they called bullish and bearish?
The terms originate from the behavior of bulls and bears. Bulls charge forward (indicating rising markets), while bears swipe downwards (indicating falling markets).
How often can the market shift from bullish to bearish?
Market sentiments can change rapidly, influenced by various factors ranging from global events to technological advancements.
Is it possible for the market to be neither bullish nor bearish?
Yes, this is termed as a ‘sideways’ or ‘consolidation’ market, where there’s relative equilibrium between buying and selling forces.


